Latest posts
-

Kubernetes Node Monitoring with Prometheus
Kubernetes node monitoring with Prometheus requires a scrape config, node exporter, and a metric cardinality model. This runbook covers setup, labeling strategy, and when it breaks.
Read more → -

Nginx Rate Limiting Configuration: Core Setup
Nginx rate limiting configuration uses the limit_req module to throttle requests by IP or zone. This guide covers the model, implementation, and failure modes.
Read more → -
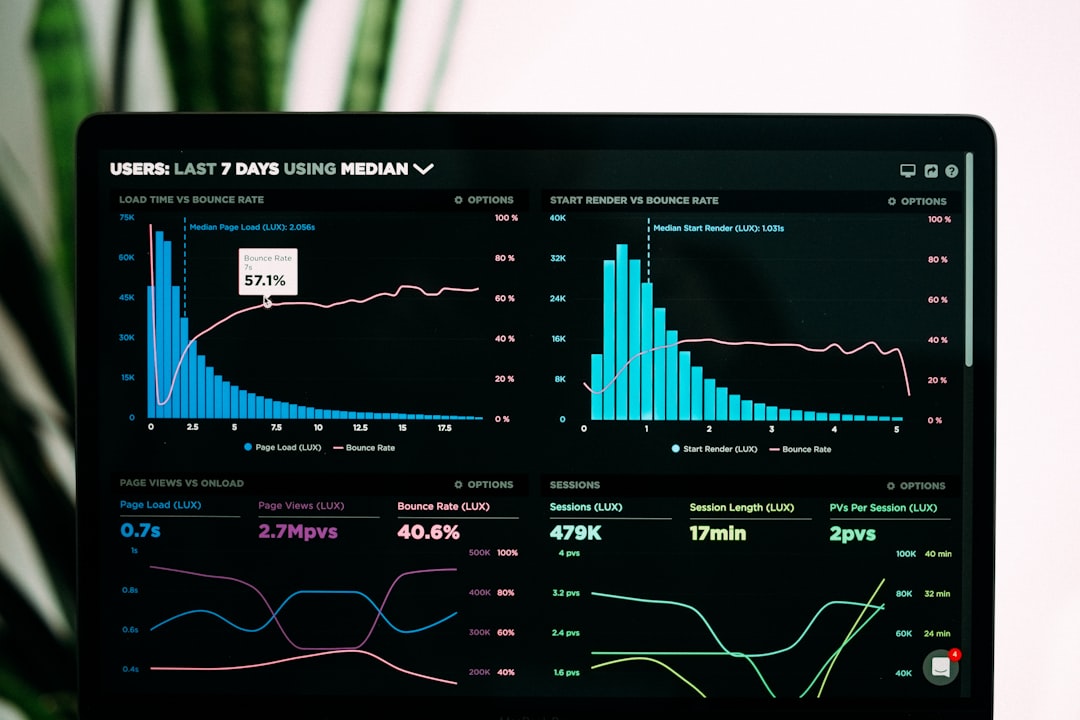
Grafana vs Datadog for Server Monitoring
Grafana and Datadog differ fundamentally: Grafana is self-hosted visualization; Datadog is SaaS with built-in instrumentation. Choose based on cost, control, and operational load.
Read more → -
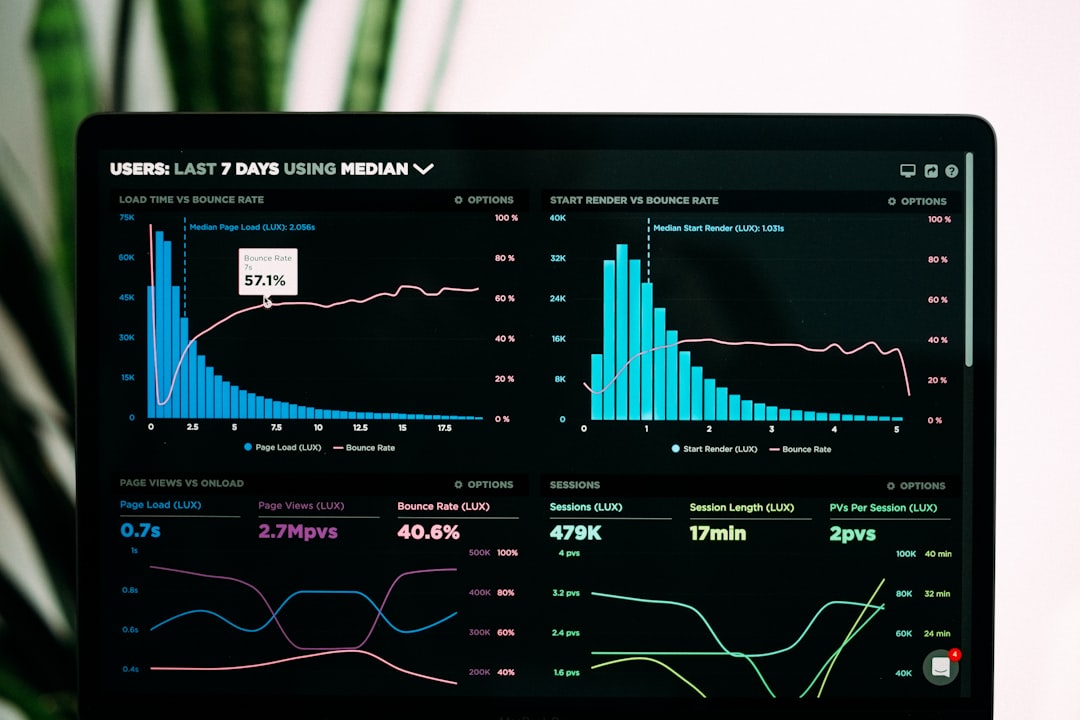
Best Open Source Uptime Monitoring Tools
Four production-grade open source uptime monitors: Uptime Kuma, Prometheus + Alertmanager, StatusCake self-hosted, and custom solutions. Runbook included.
Read more → -

CIS Benchmark Linux Compliance Checklist
A runbook-format compliance checklist for CIS Benchmark Linux hardening. Track each control, automate verification, know when manual review is required.
Read more → -
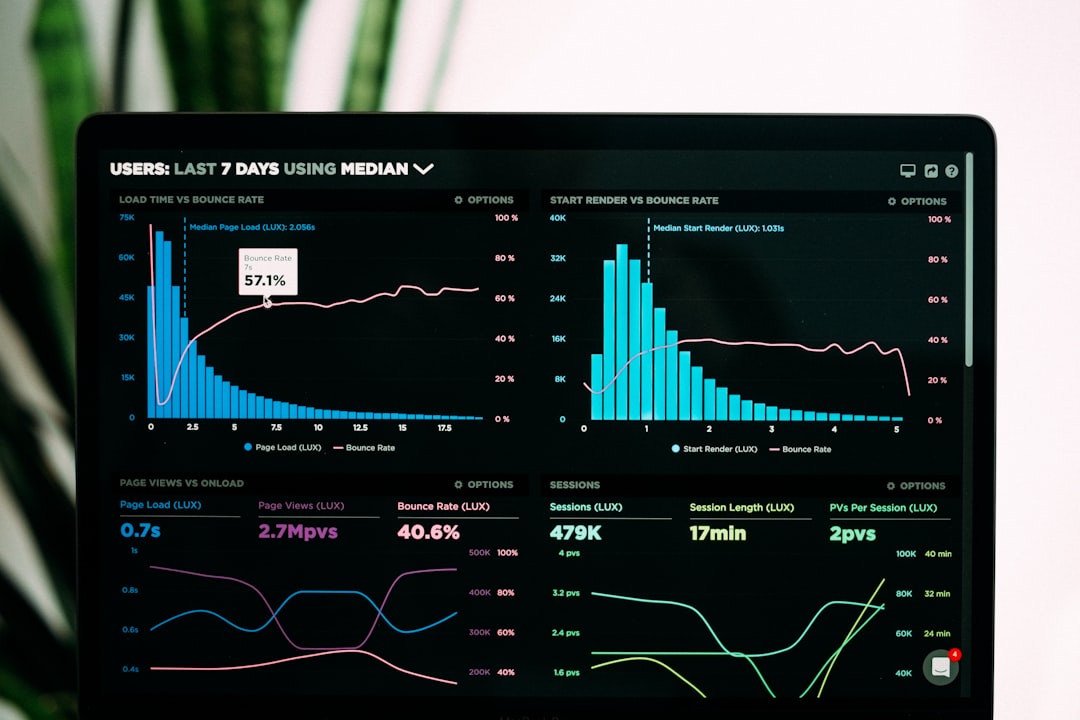
How to Set Up Log Aggregation with Loki
Log aggregation with Loki centralizes logs from distributed systems without indexing every field. Learn the architecture, config, and common pitfalls.
Read more → -

Linux Kernel Sysctl Hardening Parameters
Kernel sysctl parameters control network stack behavior and security posture. Learn which ones matter, how they work, and when they break production.
Read more → -
How to Set Up Grafana Alerting: Step-by-Step
Grafana alerting routes metric anomalies to your team. Learn the contact point, notification policy, and alert rule workflow in one runbook.
Read more → -

Fail2ban Configuration Best Practices
Fail2ban configuration best practices: filter design, jail tuning, and action chains that stop brute force without false positives.
Read more → -
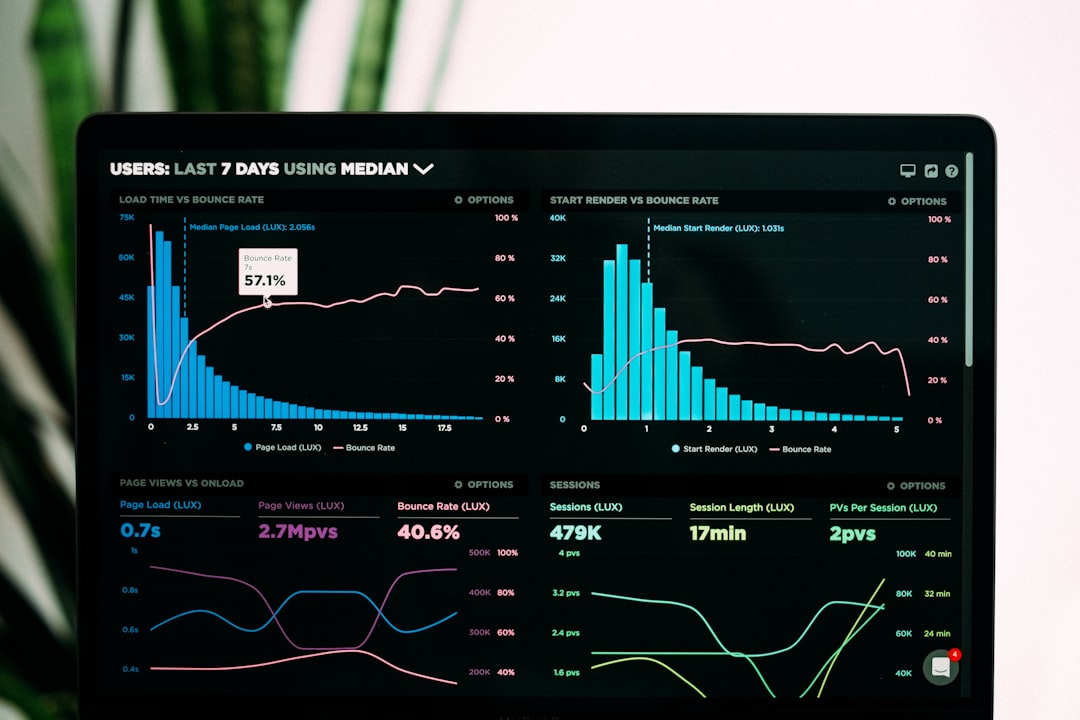
Prometheus vs Grafana vs Datadog: Pick Your Stack
Prometheus scrapes metrics, Grafana visualizes them, Datadog does both—plus logs and traces. Choose based on cost, scale, and operational burden.
Read more →